Русские Блоги
Разработка STM32, вывод функции Printf в утилиту через функцию SWO
Разработка STM32, вывод функции Printf в утилиту через функцию SWO
1 Обзор
1.1 Обзор ресурсов
Плата разработки: официальная плата разработки ST NUCLEO-F103RB
Версия CUBEMX: 1.3.0
Версия MDK: 5.23
Модель основного управляющего чипа: STM32F103RBT6
1.2 Введение в функцию SWO
SWO также называется функцией трассировки. С помощью этой функции вам нужно только добавить кабель SWO на основе отладки SWD, чтобы реализовать аналогичную функцию последовательного вывода и распечатать соответствующую информацию в окне утилиты с помощью функции printf. Эта функция не занимает ресурсы последовательного порта и не требует выполнения в прерываниях.
1.3 Введение в ITM (микроустройство трассировки инструкций)
Наша функция реализуется вызовом ITM.
ITM — это управляемый приложением источник трассировки, который поддерживает методы отладки printf для отслеживания событий операционной системы (ОС) и приложений и публикации определенной системной информации. ITM публикует информацию для отслеживания в виде пакета, который состоит из следующих частей:
● Отслеживание программного обеспечения: программное обеспечение может публиковать информацию о пакете, напрямую записывая регистр возбуждения ITM.
● Отслеживание оборудования: ITM выпустит информационный пакет, созданный DWT.
● Отметка времени: отметка времени отправляется в соответствующий пакет. ITM содержит 21-битный счетчик для создания отметки времени. Тактовая частота Cortex-M3 или битовая тактовая частота средства просмотра последовательной связи (Serial Wire Viewer) обеспечивает синхронизацию счетчика.
Информационный пакет, отправленный ITM, выводится в TPIU (модуль интерфейса порта трассировки), TPIU добавляет несколько дополнительных пакетов (см. TPIU), а затем выводит полную последовательность пакетов в отладчик. 1
1.4 Реализация функций
В этой программе реализованы следующие функции.
1. После сброса распечатайте информацию в Serial Wire Viewer (служебная программа);
2. Нажмите кнопку BUTTON, и светодиод LED2 загорится;
Для второй реализации этот документ не описывает ее подробно.
2 Подключение оборудования и настройка CUBEMX
2.1 Подключение оборудования
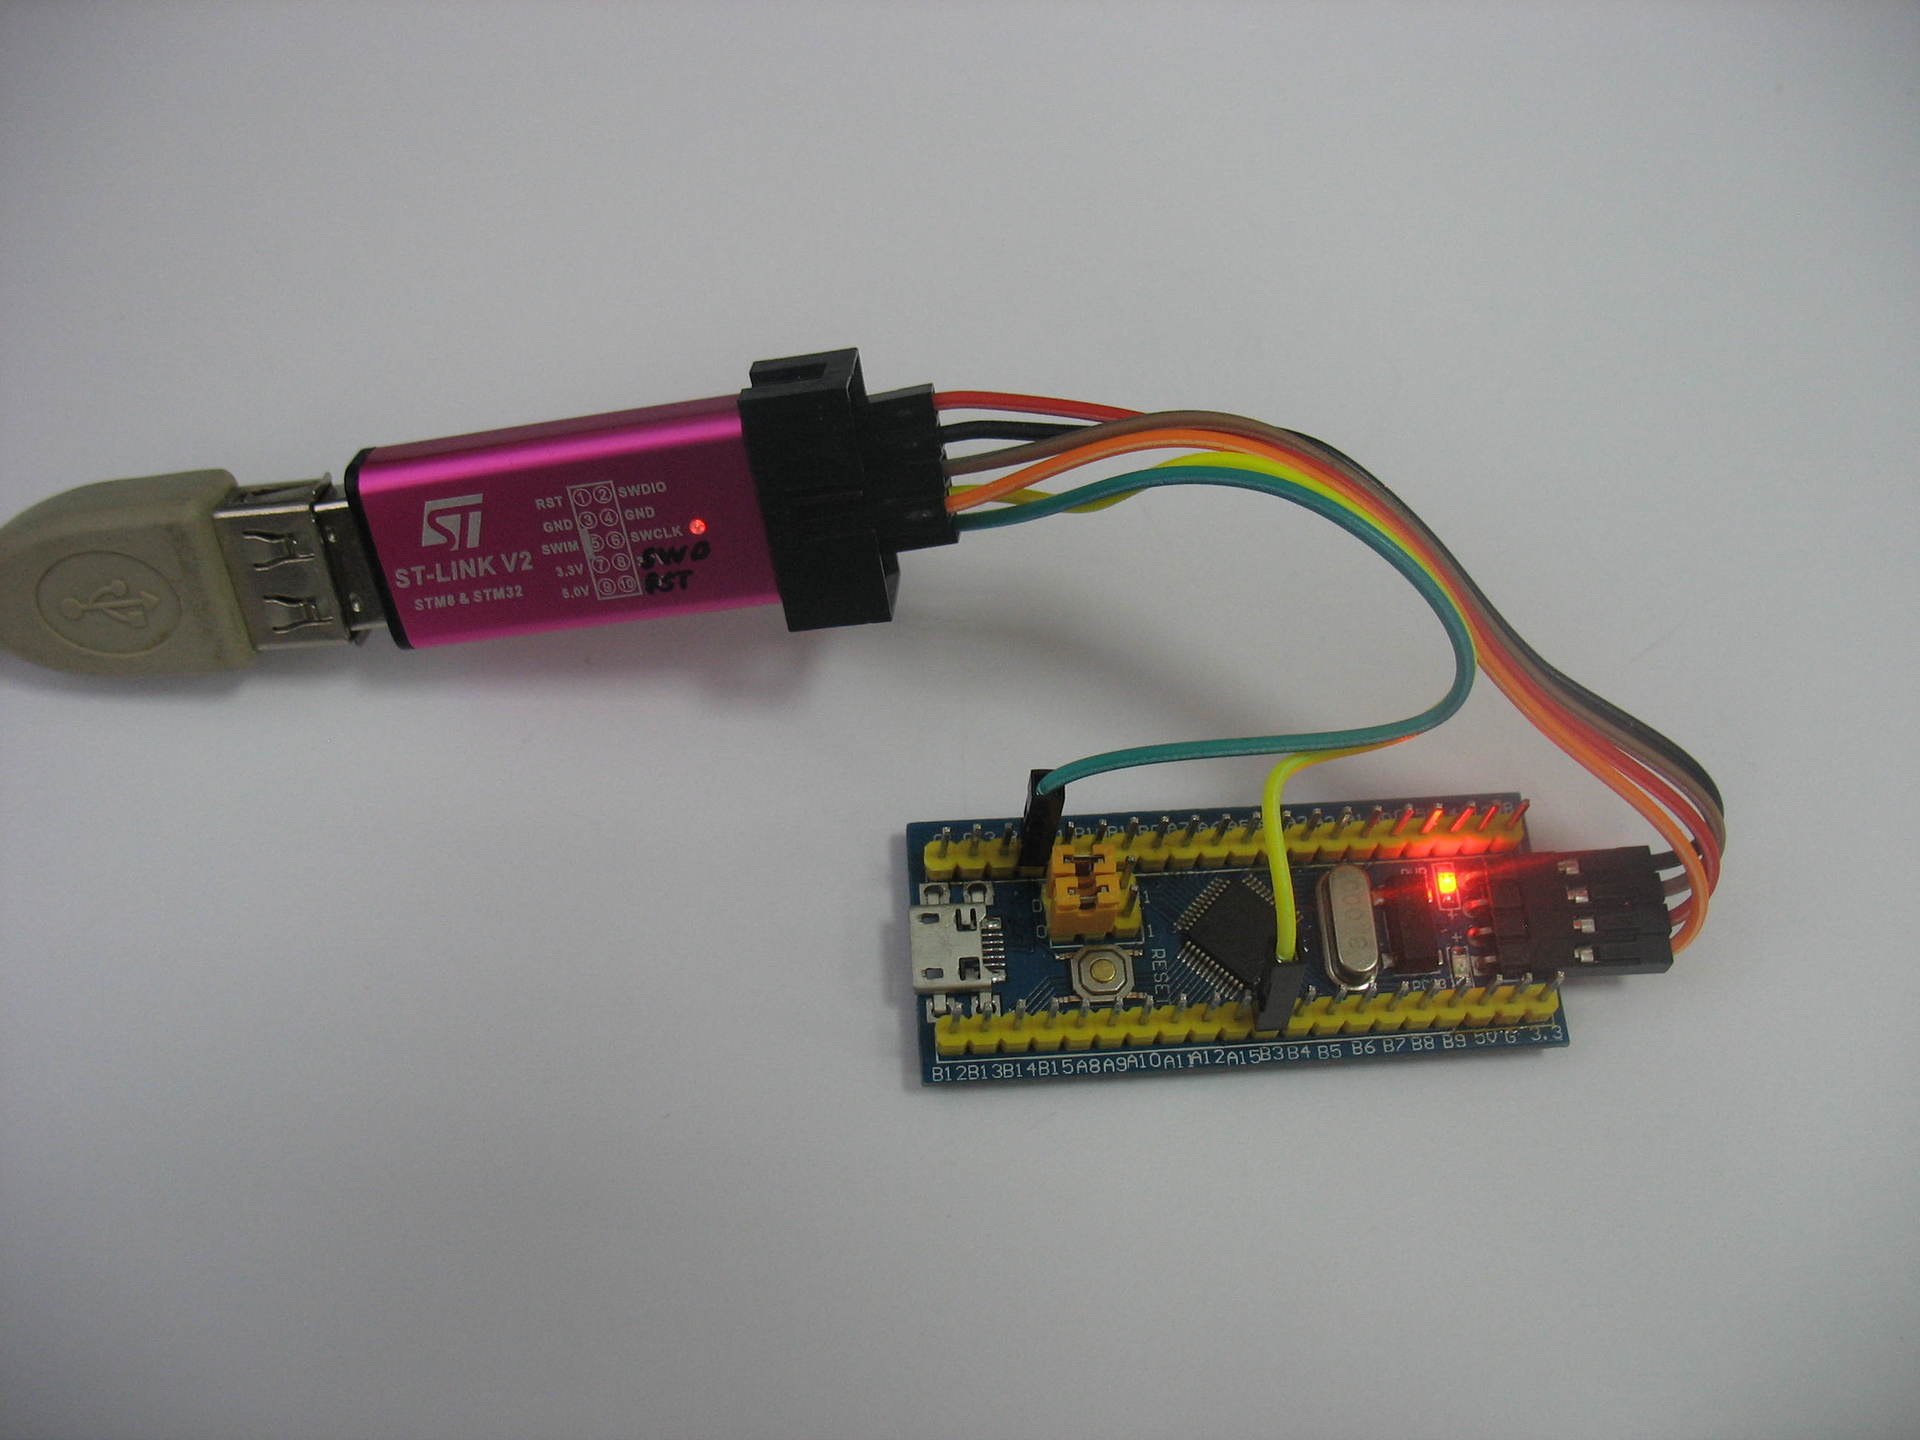
Провода были подключены внутри платы разработки, как показано на рисунке ниже. 
Когда целевая плата отделена от эмулятора STLINK, нам нужно использовать 5 проводов для подключения, как показано в следующей таблице.
| Серийный номер | Подключить сеть | Замечания |
|---|---|---|
| 1 | VCC | Положительный источник питания, 3,3 В |
| 2 | GND | Мощность отрицательная |
| 3 | SWO | Функция отслеживания ПО |
| 4 | SWDIO | Ввод и вывод данных ПО |
| 5 | SWCLK | SW тактовый сигнал |
2.2 Конфигурация CUBEMX
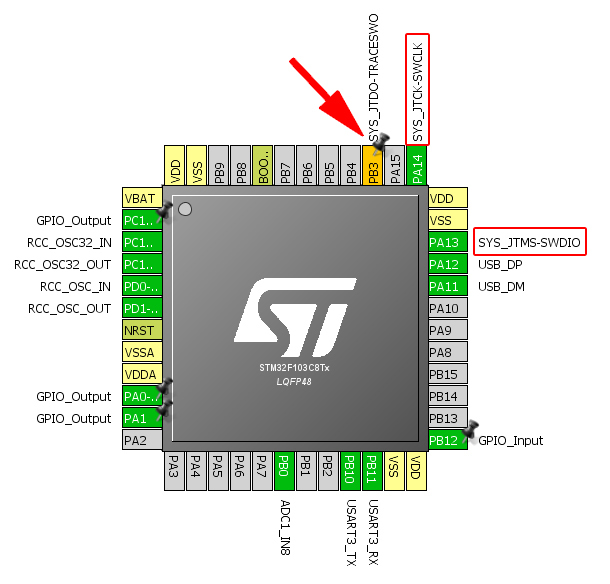
Выберите режим асинхронного отслеживания, при этом PB3 будет автоматически определен как порт SWO. 
3 Разработка программного обеспечения
3.1 Настройки программного обеспечения KEIL
Настройки программного обеспечения KEIL следующие, здесь, поскольку внутренний HSI, используемый программой, системная частота составляет 64 МГц, поэтому введите 64 МГц, которые необходимо заполнить в соответствии с реальной ситуацией. 
3.2 Дизайн программы
Используйте CUBEMX для генерации кода. Измените в основной функции.
Основная программа содержит файл заголовка функции stdio.h, иначе функция printf не будет распознана.
Определение макроса функции fputc.
Определение функции, поскольку printf вызывает функцию fputc, посредством такого преобразования функция printf может вызывать функцию ITM для реализации функции вывода.
Функция TIM_Sendchar () определена в заголовочном файле core.cm3.h, как описано ниже.
Функция printf добавляется к основной функции main () для достижения вывода.
4 Экспериментальные результаты и резюме
4.1 Результаты экспериментов
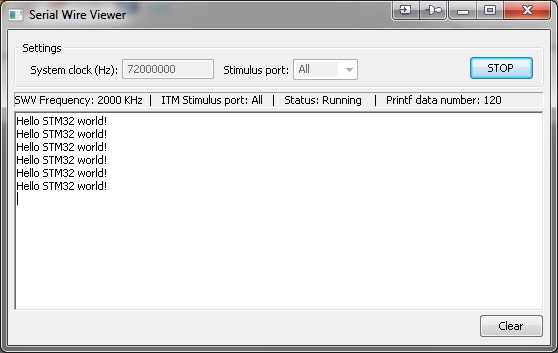
Откройте служебную программу и щелкните printf через программу просмотра SWO. 
Задайте частоту, нажмите "Пуск" и сбросьте плату отладки (настройка программы запускает printf только один раз, поэтому вам нужно сбрасывать ее каждый раз при выводе), вы можете обнаружить, что окно SWV выводит соответствующую информацию. 
4.2 Резюме
При традиционной отладке мы можем предпочесть анализировать точку останова или включение и выключение светодиода для определения текущего состояния программы, но это не слишком интуитивно понятно: чем больше программа, тем сложнее с ней работать. Использование этой функции SWO может решить эту проблему в большой программе. Мы можем добавить соответствующую оперативную информацию к различным функциям обработки ошибок, чтобы помочь нам в разработке программного обеспечения. 
Доработка китайского ST-Link v2: добавляем интерфейс вывода отладочной информации SWO и ногу Reset
Привет, Geektimes!
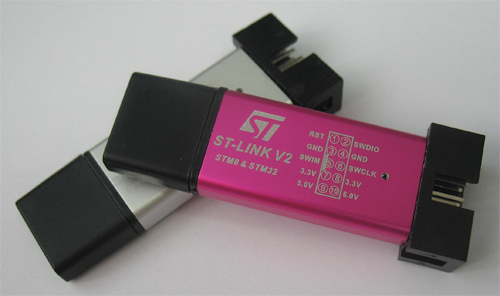
Сегодня хочу рассказать про доработку паяльником китайского ST-Link v2. В него можно допаять вывод SWO для получения отладочной информации и ногу управления Reset’ом для микроконтроллеров STM32 (та нога Reset, что уже есть — для STM8). Возможно для многих это не открытие, но пусть будет информация для начинающих. Кому интересно, прошу под кат.
Зачем оно надо?
Используемый для отладки микроконтроллеров STM32 интерфейс SWD поддерживает передачу отладочной информации через вывод SWO в режиме реального времени, это весьма удобно. Ну а нога Reset нужна для того, чтобы можно было комфортней прошивать контроллер в случае, если интерфейс SWD отключен. Причина конечно притянута за уши, ведь для прошивки всегда можно нажать кнопку Reset ручками, но пусть будет. Например, на заре моего знакомства с STM32, мне пришла отладочная плата с Китая с залитой демо программой моргания светодиодом и отключенным SWD, я не сразу понял, как к ней подключиться.
Сама доработка
 Нам понадобится скальпель, паяльник и несколько сантиметров очень тонкого провода, у меня это МГТФ *какой-то там*. На этих программаторах разъем поделен на две части: левую — для STM8 и правую — для STM32, так что существующий там Reset не подходит для STM32, будем делать свой.
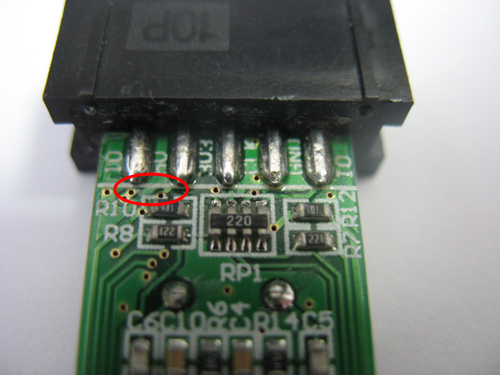
Первым делом отрезаем дорожки, идущие к ненужным штырькам. На первом своем доработанном программаторе я отрезал ножки Reset и SWIM, т.к не планировал работать с STM8, но сейчас я буду использовать лишние выводы 3.3 и 5 В (они задублированы на разъеме), чтобы не портить функционал программатора, вдруг пригодится.
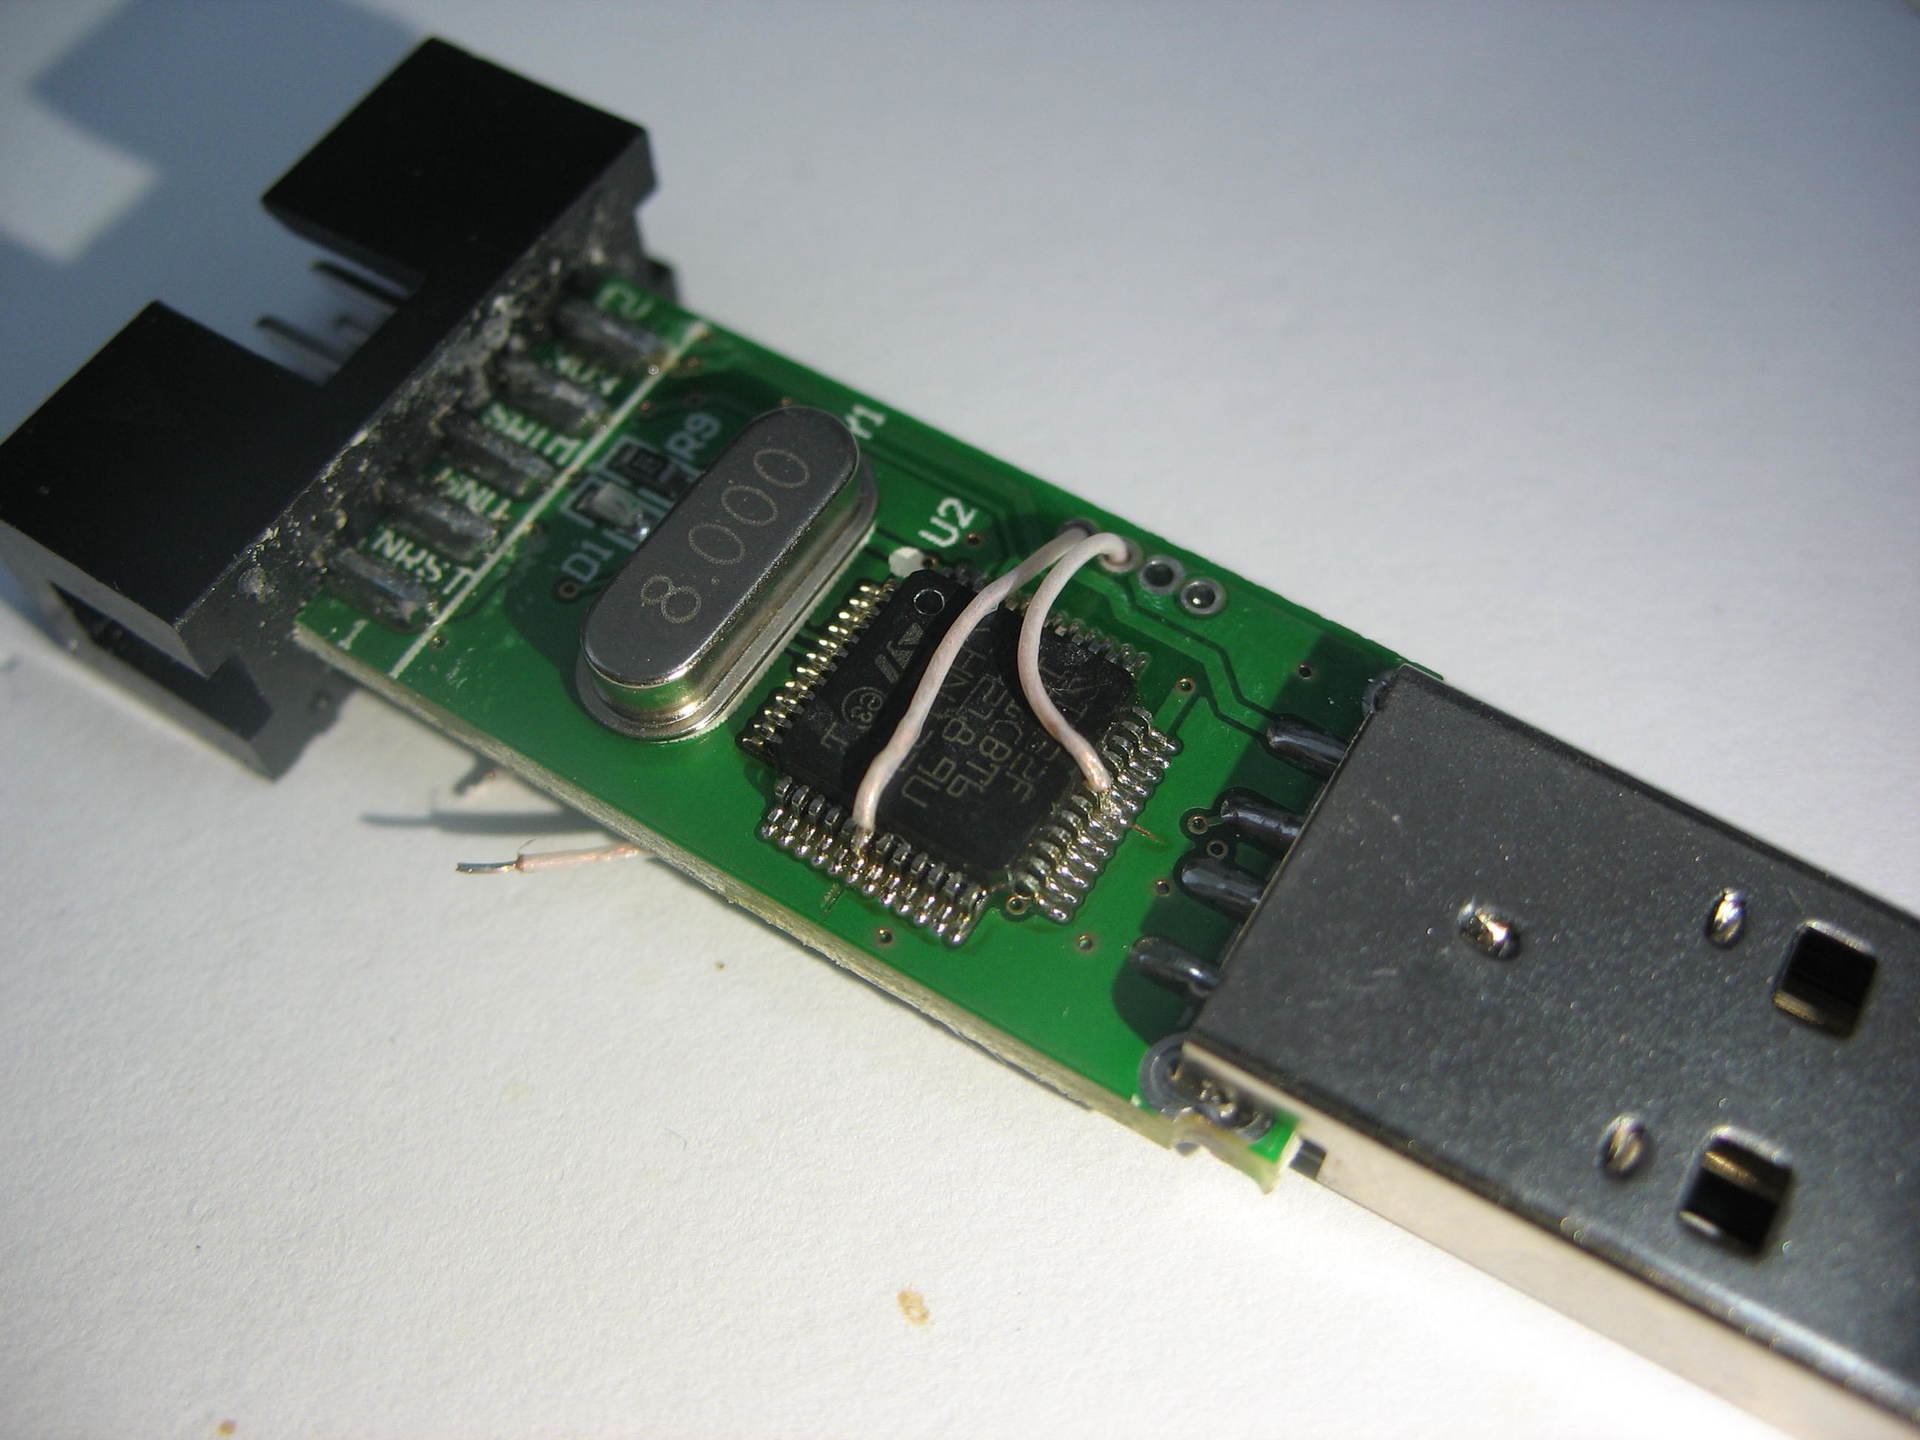
Провода необходимо припаять к 18 (Reset) и 31 (SWO) ногам микроконтроллера. То еще занятие, но при определенной сноровке сделать это можно. У меня провода хорошо вошли в отверстия на плате, что дало дополнительную фиксацию. Вообще, по-хорошему, надо сразу закрепить их клеем на микроконтроллере. Свободные концы припаиваем через небольшие резисторы (пусть будут 22 Ома) к только что отрезанным штырькам.
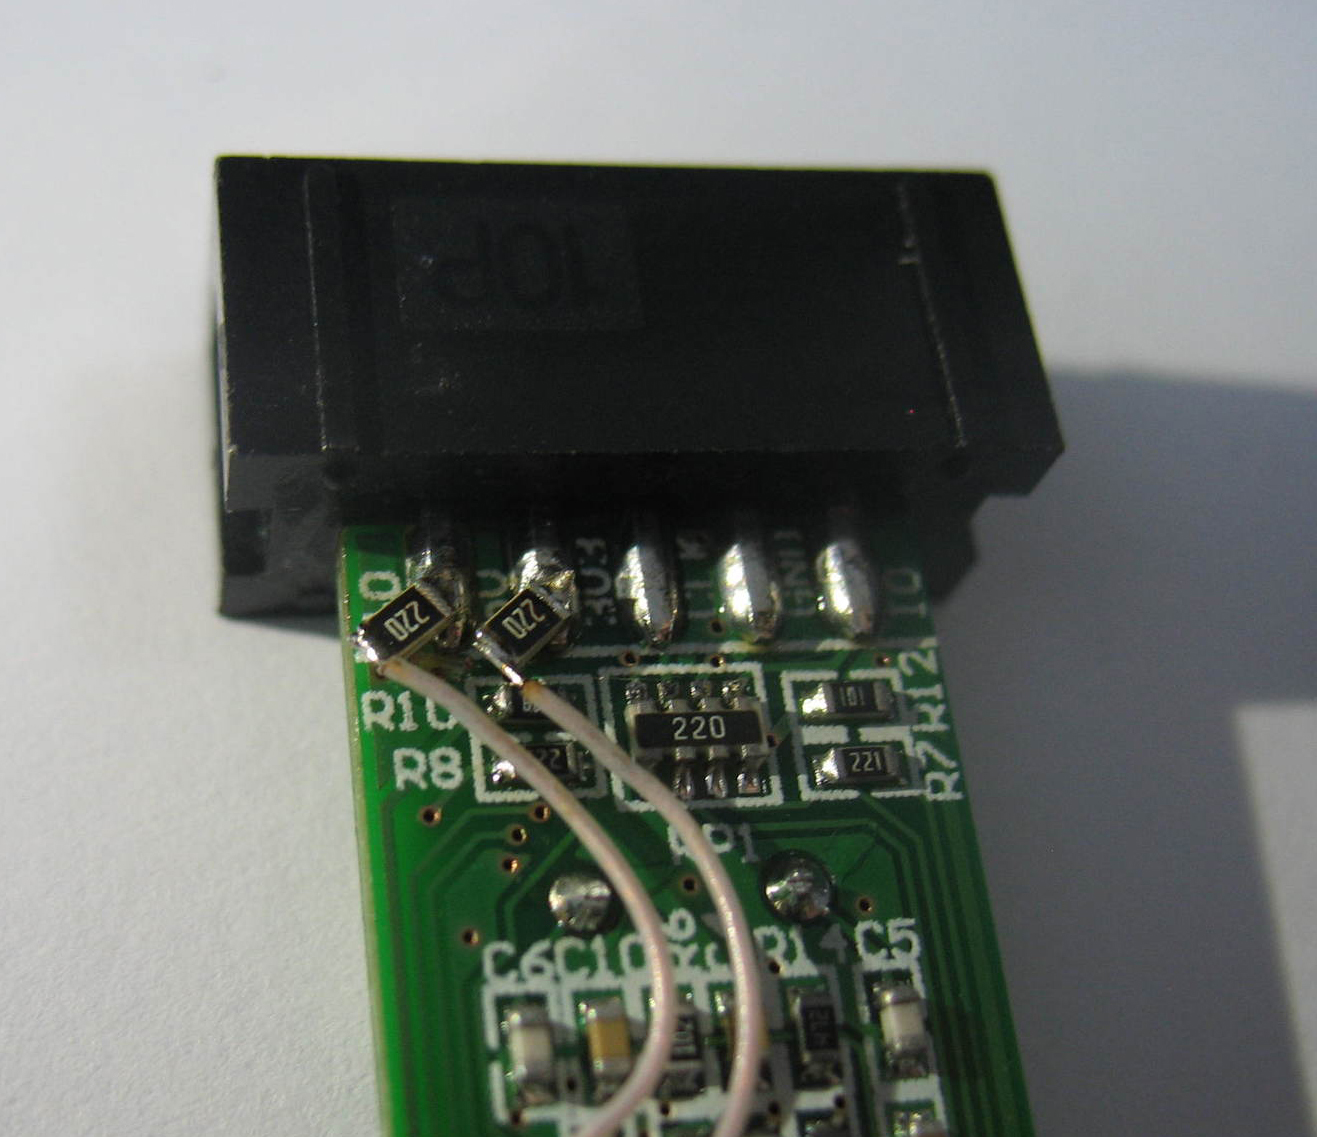
Можно закрыть корпус и подписать новые выводы, чтобы потом не забыть где какой.
Проверка SWO
Для использования SWO необходимо:
— активировать SWD;
— включить соответствующий вывод (для микроконтроллеров STM32F103C это PB3) на TRACESWO;
— убедиться, что в среде программирования включен именно SWO, а не semihosting;
— в шапке программы подключить библиотеку #include «stdio.h»;
— в коде программы использовать printf(«Hello STM32 world!\r\n»);
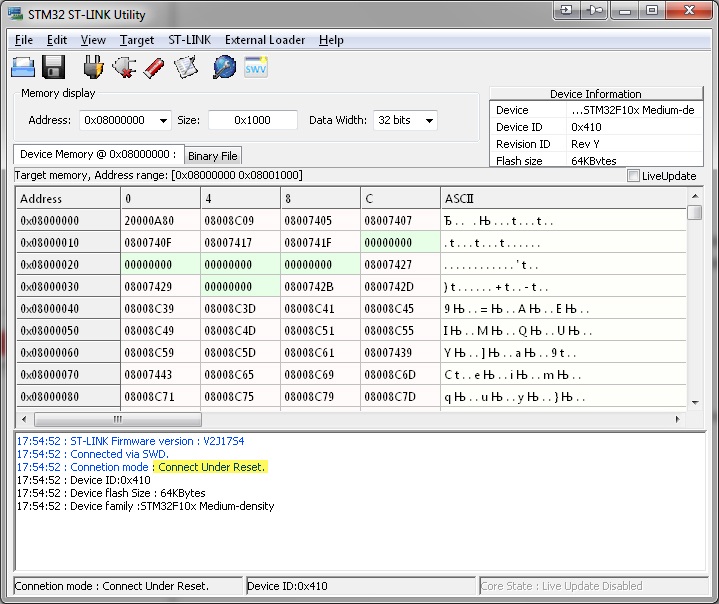
Просматривать эти сообщения можно через терминал в программе STM32 ST-LINK Utility, либо прямо во время отладки в своей среде (я использую IAR).
Проверка Reset
Допустим по какой-то причине на микроконтроллере отключен SWD: либо вы забыли его включить при инициализации, либо пришла новая плата с зашитой демо-программой. Прошиться конечно можно через притягивание ножки Reset к земле (на отладочных платах обычно стоит кнопка), но это не всегда удобно. Можно ведь просто подключить контакт от программатора и шиться в автоматическом режиме.
В той же программе STM32 ST-LINK Utility выбираем «Connect under reset» и подключаемся для прошивки или очистки памяти микроконтроллера.
Либо в вашей IDE выбираем соответствующий пункт:

Это позволит прошиться и войти в отладочный режим, но как только вы дойдете до инициализации периферии, SWD отключится и связь с контроллером пропадет.
Saved searches
Use saved searches to filter your results more quickly
You signed in with another tab or window. Reload to refresh your session. You signed out in another tab or window. Reload to refresh your session. You switched accounts on another tab or window. Reload to refresh your session.
Serial Wire Output (SWO) library for STM32duino arm Arduinos
koendv/SerialWireOutput
Name already in use
- Local
- Codespaces
Use Git or checkout with SVN using the web URL.
Work fast with our official CLI. Learn more about the CLI.
Sign In Required
Please sign in to use Codespaces.
Launching GitHub Desktop
If nothing happens, download GitHub Desktop and try again.
Launching GitHub Desktop
If nothing happens, download GitHub Desktop and try again.
Launching Xcode
If nothing happens, download Xcode and try again.
Launching Visual Studio Code
Your codespace will open once ready.
There was a problem preparing your codespace, please try again.
Latest commit
Git stats
Files
Failed to load latest commit information.
README.md
Serial Wire Output library for STM32duino ARM Arduinos
With Serial Wire Output (SWO) an stm32duino can write tracing and logging to a pc at high speed. For SWO to work, you need a debugger probe to connect the program on your arduino to the debugger on your pc. SWO only runs on systems with arm processors, sorry.
- install the arduino IDE
- install STM32duino library
- install SerialWireOutput (this library)
- connect a debugger probe with SWO support, e.g. a segger or a black magic probe. Connect the SWO output of the target with the SWO input of the probe.
- start tool to view the SWO stream.
- run example File→Examples→SerialWireOutput→HelloWorld
This is one way to connect a STM32F103 Blue Pill with a Black Magic Probe. This allows downloading firmware and debugging using SWD. At the same time, SWO provides high speed debugging output.
Take care to connect only one power source to a Blue Pill board; feeding power through usb and a power pin at the same time may cause short circuit.
Use SWOStream where you would use Serial:
In the Arduino IDE, choose Tools→Upload Method→BMP (Black Magic Probe) and Tools→Optimize→Debug (-g).
When using e.g. Black Magic Probe you typically would use commands like:
Capturing the SWO stream
Your typical debugger comes with tool a tool to capture the SWO stream.
The commercial Jlink comes with SWO viewer.
The open source Black Magic Probe has the bmtrace SWO viewer:

Companion utilities are the bmdebug debugger and the bmflash flashing tool. These tools are open source, like the Black Magic Probe itself. Download the tools and the manual.
Instead of using an external viewer to do the decoding, Black Magic Probe can also output a decoded SWO stream. In the device manager, Black Magic Probe shows up as two COM ports. On Windows , connect PuTTY to the second of the two COM ports, labeled «Black Magic UART Port». On linux, type cat /dev/ttyBmpTarg . In another window, at the gdb prompt, type
to decode a 2250000 baud SWO stream. The decoded SWO stream is sent to the serial port and displayed by PuTTY.
The SWOStream Arduino class allows you to write tracing and logging to the PC where the debugger is running. Setup parameters are:
baudRate Set baud rate.
If the baud rate is zero, the SWOStream class will not set up the SWO pin. This can be used if the debugger, SWO viewer, or another SWOStream has already set up SWO.
On a STM32F103-based Black Magic Probe, baud rate has to be 4500000 divided by an integer: 4500000, 2250000, 1500000, 1125000, 900000, 750000, . . On a bmp clone, 2250000 is a safe choice.
There is no default value. Check what baud rates your debugger supports.
swoProtocol Protocol is SWO_Manchester or SWO_Async (asynchronous). Default value is SWO_Async .
swoChannel a number between 0 and 31, used to distinguish different SWO streams. The default is 0, a safe choice.
swoEnable set this to false to instantiate with SWO disabled. Default value is true.
cpuClockFrequency Set this if your board has a non-standard crystal.
SWO without debugger
Some processors hang at power-up if you print to SWO and there is no debugger attached. As a workaround, boot with SWO disabled, and enable SWO from the debugger. To disable SWO at boot, instantiate with the fourth argument of SWOStream false, like this:
The program will start up with SWO disabled. To enable SWO from gdb, type:
Interrupt with ctrl-C:
Set Trace Enable Register all ones and continue execution:
To disable SWO from the gdb command prompt, interrupt with ctrl-C and type:
Thanks to orbuculum, Black Magic Probe book, and Stephen P. WIlliams.
If you find errors, omissions, or have additional data, feel free to open an issue.
STM32 Debugging With ST-Link v2 SWD | Serial Wire Viewer

In this tutorial, we’ll discuss how to debug your projects using the ST-Link debugger SWD and the Serial Wire Viewer (SWV) mode. How to open it and print data to the serial wire console within the IDE itself. We’ll also set up breakpoints to stop the MCU at some points in the code to check live variables while the MCU is running your firmware.
Required Components For LABs
- Nucleo32-L432KC (ARM Cortex-M4 @ 80MHz) or (eBay)
- Blue Pill STM32-F103 (ARM Cortex-M3 @ 72MHz) or (eBay)
- ST-Link v2 Debugger or (eBay)
Some Extremely Useful Test Equipment For Troubleshooting:
- My Digital Storage Oscilloscope (DSO): Siglent SDS1104 (on Amazon.com) (on eBay)
- FeelTech DDS Function Generator: KKMoon FY6900 (on Amazon.com) (on eBay) (on eBay)
Affiliate Disclosure: When you click on links in this section and make a purchase, this can result in this site earning a commission. Affiliate programs and affiliations include, but are not limited to, the eBay Partner Network (EPN) and Amazon.com.
STM32 ARM Cortex-M3 Debug Support
The ARM Cortex®-M3 & M4 core contains hardware extensions for advanced debugging features. The debug extensions allow the core to be stopped either on a given instruction fetch (breakpoint) or data access (watchpoint). When stopped, the core’s internal state and the system’s external state may be examined. Once the examination is complete, the core and the system may be restored and program execution resumed.
The debug features are used by the debugger host when connecting to and debugging the STM32 MCUs.
Two interfaces for debugging are available:
- Serial Wire Debug (SWD)
- JTAG Debug Port
The debug features embedded in the Cortex®-M3 core are a subset of the Arm® CoreSight Design Kit.
We’ll be using the SWD in this tutorial. Down below is a diagram for the ARM Cortex-M3 debugging support hardware. Which includes the ITM for the serial wire trace debugging, and extra more features.

- SWJ-DP: Serial wire / JTAG debug port
- AHP-AP: AHB access port
- ITM: Instrumentation trace macrocell
- FPB: Flash patch breakpoint
- DWT: Data watchpoint trigger
- TPUI: Trace port unit interface (available on larger packages, where the corresponding pins are mapped)
- ETM: Embedded Trace Macrocell (available on larger packages, where the corresponding pins are mapped)
ST-Link v2 (Hardware Debugger)
For Debugging Projects With The Blue Pill Board
This is the tool you need. Unfortunately, the Chinese clone on the left doesn’t support the serial wire trace debugging as it is. Because it doesn’t expose the SWO pin to its pinout. So you’ll need the original kit on the right, and the SWO pin will be connected to pin B3 of the blue pill.
Alternatively, there is a hack for the ST-Link v2 USB Clone (the one on the left). So you can solder the SWO pin out to any pin on the header. Typically we’re using only 4 out of the 10pins. So you can route the SWO pin out to any other pin. As shown in this article.  5V pin converted into SWO
While configuring the SWD debugging feature in CubeMX, you’ll notice that the SWO pin is B3. Which you’ll need to connect to ST-Link debugger. The steps for SWD debugging are going to be the same regardless of the target microcontroller.

For Debugging With Nucleo Boards (Nucleo32-L432KC)
Nucleo boards come equipped with an integrated ST-Link v2 programmer/debugger chip. It’s another microcontroller on the board itself. In the case of our Nucleo32L432KC, it’s a small microcontroller on the back of the board. It’s hooked up to the USB port on the board. It gives you full debugging capability while flashing the code easily to the board. It even gets detected as a storage device, so you can just drag and drop the binary file (hex code) to the chip directly and it’s been flashed already without any clicks!
 The Target Microcontroller STM32L432KC On The Top Side OF The Board
  The ST-Link v2 Programmer / Debugger On The Bottom Side OF The Board. It’s The One Connected To The USB Port On The Board As Well.
Obviously, no extra hardware is needed when you’re using Nucleo Boards. And the debugging steps are the same for all Nucleo boards and the blue pill with ST-Link v2. However, the Nucleo32 boards (the 32-pins small version) like the shown above, doesn’t have the SWO pin connected to the integrated ST-Link debugger ��
You’ll have to solder a bridge wire across the board with the help of the board schematic to enable this serial wire trace feature. And I won’t do this. I’ll give you the steps to debug with the serial wire viewer just in case you could hack your ST-Link clone or you have a discovery board or a Nucleo-64 maybe that doesn’t lack the connection for the SWO pin.
Create Demo Project & SWV Debug
Step1 : Open CubeMX & Create New Project

Step2 : Choose The Target MCU & Double-Click Its Name

Step3 : Configure All The Peripherals & GPIOs You’re Willing To Use In Your Project!
Whatever your project is. Just do the normal configurations as per the application. To enable the serial wire debugging, you only have to add an extra step which is the one below.
Step4 : Set The Trace Serial Wire Debugging
Note: the pin B3 is now the SWO and needs to be connected to the respective pin on the ST-Link v2 debugger
Step6 : Go To The Clock Configuration
Step7 : Set The System Clock To Be 72MHz Or Whatever You Want
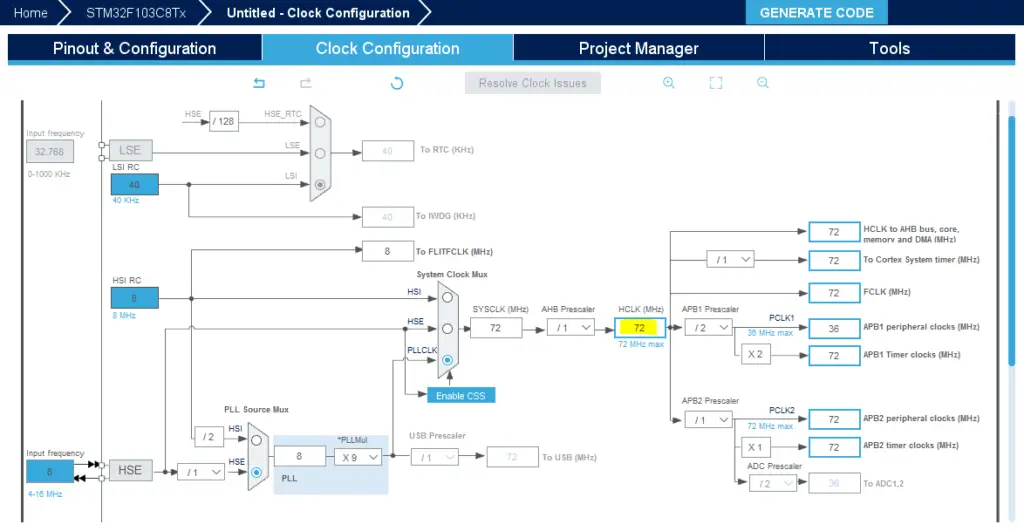
Step8 : Name & Generate The Project Initialization Code For CubeIDE or The IDE You’re Using
Then, open the project in the IDE you’re using. And head over to the main.c file.
You’ll need to add this function to your main.c file before the main function. In case you’re not including the syscalls in your project yet. It gives the implementation for the printf() function so as to print the data over the ITM trace.